Pages

Showing posts with label SEM. Show all posts

Wednesday, June 25, 2014

13 Reasons Branded PPC Campaigns Are Beneficial For B2B Brands

Branded PPC campaigns are a difficult concept to swallow for many marketers. Why would someone pay for a branded term they already (and will always) rank first for in organic search?ppc-featured
In the B2B world, paying for terms surrounding your brand can yield numerous benefits. Here are the top 13 reasons you should consider building a branded campaign for your B2B brand.

1. Domination In SERPs

Having multiple listings on one search engine results page (SERP) is a way to deliver a wider range of brand messaging to searchers. It also creates more opportunities for searchers to click through to your website.

By appearing in both organic and paid listings, you will be the prominent player in your space. Paying for keyword listings is also the only way you can guarantee yourself that first spot.

2. Control Your Brand Messaging

One of the downfalls of organic listings is that certain guidelines need to be followed to keep in best practices with current SEO trends. Since keyword targeting is a must for organic listings, you are limited in how you can deliver your brand messaging.

With paid search, you can craft your brand messaging to grab the attention of searchers and drive them to your site.

3. Fight Against Competitor Bids On Branded Terms

An effective PPC tactic that has been used for a while now has been bidding on competitor branded terms.

If a competitor is bidding on your branded terms, the best way to fight back is to bump them down a peg by buying your own branded terms. After all, your bids will be much lower and quality scores much higher, whereas competitors have to shell out a lot of dough to compete for your terms.

4. Branded Terms Are Cheap

Some of the cheapest keywords you’ll ever bid on are those of your own brand. Bidding on your own brand usually costs pennies per click. These dirt-cheap clicks will also generate high click-through rates (CTRs) and quality scores.

5. Build Account Equity

Aside from being cheap, having high CTRs and earning high quality scores, this level of performance will also help build account equity.

Although account history doesn’t directly affect ongoing quality score, it has long been speculated that maintaining an account over time that follows best practices, gets good quality scores and achieves high CTRs does have an effect on the success of your future campaigns.

(A few things I have noticed that may be related to account history are keywords starting out with higher or lower quality scores, and quicker approval on ads.)

6. Accelerate Buying Decisions From Current Prospects

Users searching for your brand already have some level of familiarity with your brand and products, whether it’s from a colleague, tradeshow, direct mailing piece or other channel. These users may be anywhere from the beginning to the end of the sales cycle.

By bidding on branded terms, you have the ability to send these prospects to a landing page to get your company messaging, thought leadership material and other assets in front of them to move them further down the sales cycle. An organic listing just sends them to your site, with little control of what content you want to put in front of them.

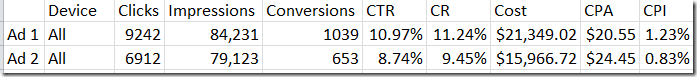
7. Paid Traffic Can Convert More Effectively Than Earned Traffic

PPC landing pages are usually optimized to drive users to complete a conversion action. Because of this, conversion rates tend to be higher on these landing pages than on regular website pages.

As mentioned in my previous point, people who click on ads for branded terms are already in the sales cycle, and well-optimized PPC landing pages can accelerate that buying decision.

8. Competing In SERPs With Affiliates & Distributors

One of the biggest challenges in search for B2B marketers is having to compete with your own affiliates and distributors.

Your affiliates and distributors want to use your brand equity to their advantage, so they will often bid on your branded terms — especially for product-related branded terms.

If your sales culture has a strong interest in making sales in-house instead of relying on distributors, creating a branded campaign is imperative.

9. Test Out New Brand Messaging

If you plan on creating advertisements and other collateral to promote through other channels, branded PPC campaigns offer a cost-effective way to test new brand messaging.

For pennies per click, you’ll be able to determine if a new brand message is effective before spending thousands of dollars blindly sending it out through other marketing channels.

10. Promote New Products Or Services

Every time a new product or service is created, you have to add new content on your site, create collateral and thought leadership, and use multiple marketing channels to promote the materials. It takes a while to gain momentum through those channels. Ranking in organic search for keywords around the new product or service may take anywhere from several weeks to several months.
Paid search offers an opportunity to rank first in search immediately for both branded and non-branded terms around the new product.

11. User Attention Is Drawn To Ads

Google likes to make money, and AdWords is one of their primary drivers of revenue. With that in mind, they are constantly testing new ways to make ads appear in SERPs.
Example of a branded SERP with both paid and earned listings.

In the past, they have highlighted the ads with a yellow, blue and pink background color to make them stand out above organic listings. Their latest tactic seems to be making them blend in with organic listings. Either way, Google will constantly be testing new designs to drive more ad clicks, because that’s how they make their money.

12. Damage Control

Let’s hope this is never necessary, but if your company makes a big “oops” and becomes the target of negative press coverage, a branded PPC campaign is one solution to push that negative press down the SERPs.

Looking at the example below, you can see that Feedly, a company that recently became the target of a cyber attack and does not currently run a branded PPC campaign, is dominated in SERPs with negative press. This negative press has taken the top position in the SERP, and includes attention-grabbing elements like the thumbnail, timestamps and border.
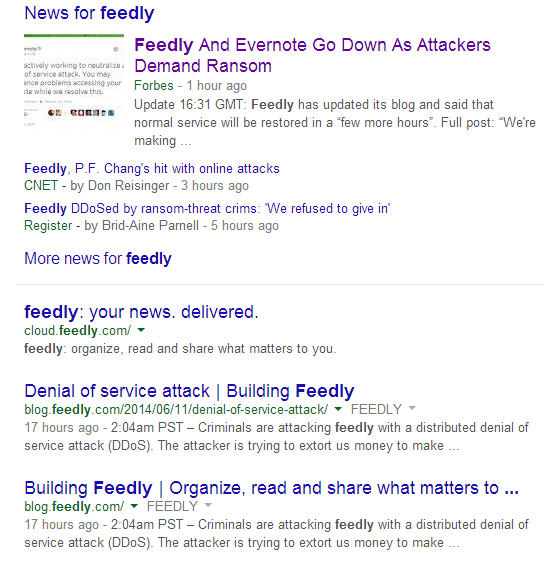
Example of negative press effecting brand image in search

13. Retaining Traffic After A Search Engine Penalty

One of the most devastating things that can happen to your brand in digital marketing channels is the inability to appear for your own branded terms as a result of a penalty from search engines. Recovering from a manual or algorithmic penalty can take several months before rankings are restored.

A branded and non-branded PPC campaign is one solution to retain search traffic until you recover from the penalty.
 (Stock image via Shutterstock.com. Used under license.)

Saturday, January 4, 2014

PPC Excel Tips For Every Level: Part 3, Advanced Level Keyword Research And Data Visualization

While many of the tips we’ve covered can also help SEOs as well as PPC practitioners, today’s focus on keyword research is particularly relevant to both camps.

Advanced Tip: Bing Ads Intelligence for deep-dive keyword research and Power BI for big data analysis and visualization.

Bing Ads Intelligence is an Excel add-in for keyword research that enables Excel to integrate directly with your Bing Ads accounts. However, you can use this tool for keyword research outside of Bing Ads campaigns as well.

Once you download the add-in, you’ll see the Bing Ads Intelligence tab in the top navigation. If you want to download your campaign data, sign in to your Bing Ads account by clicking “Sign In” icon to the far right. You can then see your keywords along with performance metrics.
Bing Ads Intelligence Excel PPC Tips

These are top 3 features in Bing Ads Intelligence:

1. Keyword Suggestions: Keyword recommendations fine-tuned from Yahoo Bing Network data.
What’s also interesting about the Keyword Suggestion tool is that it will give include suggestions for match types not currently in our account along with the performance data and estimated bids for mainline and sidebar positions. Not only that, but you can run the Keyword Suggestion tool for any list of keywords, not just those already in your account, and it will show the broad, phrase and exact match statistics for each variation. Don’t want to look at phrase match types? Just use the filter to hide them from the list.

 2. Traffic: See the number of searches users conducted on the Yahoo Bing Network for a specific query.
The Traffic tool can be used to look at multiple keywords or one. The cool thing about this feature is you can see historical trending and you can break out performance by device. In the example below, I’ve chosen to see the traffic performance of the keyword “classic cars sale” on Desktops and Laptops and then on Smart phones by week. In this example, Desktop and laptop traffic trended down closer to Thanksgiving, while Smart phone traffic actually ticked up slightly in that final week of November. You could break this down by day if you wanted as well.

Bing Ads Intelligence Traffic Report

3. Keyword Performance: For any keyword, it will show you a snapshot of keyword performance by position. This can be powerful when trying to estimate traffic and set bidding strategies. Again, these don’t need to be words you are currently bidding on in your account, and you can separate results based on device type and match type. To see the performance stats for a keyword by every position, select “All” at the bottom of the Ad Position drop down menu as shown below.

Bing Ads Intelligence Keyword Performance (2)

Quick note: You’ll notice the shading in several columns in the tables above. This is done using Conditional Formatting, found under the Home tab. Conditional Formatting allows you to shade and color cells based on their values to be able to better visualize opportunities and problems.

In the Keyword List Generator template shown below, conditional formatting rules are set using the Conditional Formatting Rules Manager to show a different color in each metric column. In this table you can quickly see that, while the search volume for “buy new laptop” is relatively low, the CPC and Average Bid are high. With this template, you can add any sequence of keywords you want. Hitting the “Refresh All” button under the Bing Ads Intelligence tab will update the data keyword variations.

Excel Conditional Formatting

You can find this template and others for download by clicking the “Keyword Research Templates” button under the Bing Ads Intelligence Tab. There is much more to explore with this tool, so if you haven’t done so, download it and start experimenting.

Power BI
For those with the right software, Microsoft’s new Power BI tools for Excel offers advanced-level tools for data analysis. Here is the feature set for Excel in Power BI
  • Power Query – Connect to data from public and corporate data sources including databases, web pages, even Facebook graph data.
  • Power Pivot – Data Modelling tool that can handle nearly 2 billion rows of data
  • Power View – Create reports and analytical views with interactive data visualizations
  • Power Map –Visualize your campaign (or other) data geographically in 3-D within Excel
I am excited about Power Map for search advertisers. With it you can take the “geographic location” data from the dimensions report in Bing Ads and put it into Power Map to see where clicks are coming from by geographic location, for example.

PPC Excel Tips Bing Ads GeoFlow PowerMap

There is a barrier to entry here, however. You will need Office Professional Plus 2013 or Office 365 ProPlus to run Power Map. If you meet those requirements, the Power Map and Power Query can be downloaded here. If you’re working with huge amounts of campaign data, Power BI tools could give you the bandwidth you need. Power Map also has broader applications beyond your own campaign data. You can import third-party or your CRM data to map out and see where your current customer and prospect bases are located for clearer insights into content development and campaign targeting. Think about the types of data sources available to you and how they might be able to inform your marketing efforts in new ways using Power BI tools.
That closes out our PPC Excel Tips series, just in time to usher in 2014. If you have tips and tricks of your own to share, please do so in the comments below.

PPC Excel Tips For Every Level: Part 2, Huge Time Savers For Beginners (And Beyond)

Excel is that must-have tool for managing, analyzing and reporting on paid search campaigns that is impossible to know too well. Many of us are self-taught — picking up tips and tricks here and there — which makes it even harder to know what shortcuts and secret powers we’re missing out on.


Beginner Tip: Don’t under estimate the time-savings to be gained from Keyboard Shortcuts.
I hesitate to even qualify these as beginner tips because it’s easy to have worked with Excel for years and not know every shortcut.  Rule of thumb: don’t waste time using your mouse if you don’t have to.  Make handy keyboard short cuts a natural part of your work process, and you’ll be amazed how much extra time you’ll have on your hands for actual analysis.

1. Automatically SUM() with ALT + =
John says he’s used the =Sum() formula for years, but recently discovered this function.  Automatically SUM() an entire column or row by clicking in the first empty cell in the column. Then press the ALT button and the = (equals) key to sum up the numbers in the above cells.

Excel Tip Automatically Sum With Keyboard Shortcut 

2. Copy Formulas with a Double-Click

While not technically a keyboard shortcut, this trick is a huge relief for anyone working with repeating formulas, such as a conversion rate or click-through rate calculations. After entering your formula hover the bottom right corner of the cell with your mouse until a little plus sign appears. Then just double click. The formula will copy down into the cells of that column to calculate the data in the rest of the rows in the spreadsheet.

Excel tips for PPC Double Click To Copy Down Formulas

3. Currency And Percentage Formatting Shortcuts
Keyboard shortcuts are only handy if you can remember them. John points out that there is actually logic behind when to use CTRL and SHIFT in keyboard shortcuts that will help you remember when to use them.
To format a number as a currency without having to use your mouse, the keyboard shortcut is CRTL + SHIFT + 4. Why? Well, Shift + 4 is how you type a dollar sign ($). Adding CTRL will then format the cell (or cells) as currency. The same works for formatting numbers as percent with CTRL + SHIFT + 5.

Excel PPC Tips Number Formatting Keyboard Shortcuts
Excel for PPC Keyboard Shortcuts

Sunday, December 1, 2013

Now “Undo” Google AdWords Changes From Change History Reports

Taking action after a completing a test in Google AdWords may just have become a whole lot easier. An new “undo” button was spotted last night in the Change History.

Here’s a screenshot from Heather’s account after she clicked on the “undo” button next to one of the line items. Heather notes that a new line item is created when the change is marked as undone, and the “undo” button is made available in case you want to revert back again.
Google AdWords Undo Button in Change History Reports

The feature doesn’t appear to have rolled out to everyone yet, so you’re not alone if you don’t see it yet.

Saturday, November 23, 2013

Using Paid Search To Aid Your SEO

A lot has changed in the world of search marketing over the last year. From Enhanced Campaigns to Hummingbird and not provided, search marketers have had to rethink and re-calibrate their strategies significantly. Some changes caused more uproar than others; but, one thing has become increasingly clear: the art and science of both SEO and paid search, respectively, are on a crash course, and a consolidated strategy is required to get the most out of both channels.

At my agency, we’ve been working on ways to get more creative with our PPC campaigns in order to directly benefit our SEO efforts. PPC has much more immediate and measurable results than SEO, and as a result, we can use paid search as a testing environment for SEO strategies. The goal is to provide a proof of concept before investing any long-term resources into a project.
In the holiday spirit, we’d like to share three of the concepts we’ve tested and had some success with.

1. Keyword Identification

Both paid search and SEO revolve around keyword lists. Paid search provides one of the cleanest environments for organically identifying search queries used to reach your site.
Search Query Reporting
When using paid search to inform your SEO keywords, you should:
  1. Identify the highest converting and highest cost-per-click keywords in your paid campaigns driving high value visits
  2. Organize by difficulty to rank organically on these terms through Google keyword planner and SERP analysis
Prioritize SEO resources to rank for converting and/or high-value, visit-generating search terms by developing and promoting content around those terms.

2. Title & Meta Description Testing

Paid search ad copy consists of a maximum 95 characters. Meta descriptions are optimally 155 characters. Those aren’t exact matches, but the character limits are close enough to legitimize a testing ground for user preference.
AB test description snippets in ads tied to relevant keywords. Let click-through rates dictate description evolution while considering Quality Score improvements as Google’s way of suggesting what is and isn’t relevant.
Meta Description Opportunities
In the example above, Foot Locker could use proven paid search ad copy to write up an engaging meta description.

3. “Proof Of Content” Testing

Targeting a highly competitive term for SEO can be costly. Working all the way to the top only to find out that your content is not what users are looking for is both frustrating and a waste of resources.
Paid search can be an effective way to quickly and efficiently send traffic to new content to gauge user reaction and test interaction rates. If users like the content, so should Google.
Build out a handful of ad groups with highly relevant keywords and ad copy directing traffic to the content you wish to promote. If the call-to-action is clear, then the data should tell you fairly quickly whether or not the content is viable and potentially valuable.
The cost to generate a statistically significant amount of data via paid search is far less than the cost of technical resources to rank organically in a top position.

Concluding Thoughts

Whether your marketing department is on a shoestring budget or you work for a large corporation with unlimited resources, you need to be intelligent about prioritizing your search marketing efforts. Chances are your paid search team is already doing most of these tasks and can easily incorporate some ad hoc analysis to aid SEO efforts.

Thursday, July 25, 2013

Quality Score Explained by former Google Employee

With the continuing expansion of ad space at the top of the page (from ad extensions like sitelinks with descriptions), it’s more important than ever to make sure your ads have a great ad rank. But CPCs are on the rise – so unless you can improve your conversion rate so you can increase bids, Quality Score (QS) optimization may be your only way to maintain a high rank without breaking the bank.
While I’ve been a panelist representing Google in Quality Score sessions at more conferences than I can remember, I’ve been meaning to put together some of my insights on the topic for a broader audience. So, here goes….

The Evolution Of Quality Score

Even if you don’t care much for a history lesson, it may help paint a picture of why QS exists in the first place, and the evolution of factors may give you some insight into what Google cares about.
When I started working at Google in 2002, Quality Score didn’t exist. But what set Google apart from the other PPC ad systems at the time was how they determined if ads were relevant enough to warrant an impression. In addition to having a team of humans reviewing all ads, the system was also monitoring the click-through rate (CTR) of every keyword — if a keyword’s CTR fell below 0.5%, it would become disabled for poor relevance. Google was using the wisdom of the crowds to let its users determine which ads should show and which shouldn’t.
The problem with disabling keywords at an arbitrary CTR level was that advertisers were unhappy to see some of their keywords disabled forever (unless, of course, they knew of the workaround to resubmit the same keyword with different capitalization). So, we started to evolve the system. Instead of disabling keywords, we came up with new statuses like “slowed,” “in trial” and “on hold.”
The idea was to give advertisers a way to fix low-relevance keywords by giving them a small allowance to run ads that were considered poor quality so that they might prove otherwise. We also gave the system more flexibility so there wasn’t a hard cutoff at the 0.5% CTR level. Ultimately, though, most advertisers still saw keywords they really wanted to advertise on get disabled, and they remained displeased.
Google addressed this with the introduction of the minimum bid. Rather than flat out disabling keywords, they asked advertisers to pay more for keywords that had low relevance — the idea being that eventually, it would make no sense for an advertiser to keep paying the high cost-per-click (CPC), and they’d either optimize the relevance or delete the keyword.
In today’s system, the minimum bid has been engulfed by the first page bid, which also takes into account competition. It’s a little harder to see the direct correlation between what you pay and the quality score, but the connection’s definitely there.
Below is an example of where we see the correlation between the average CPC and the QS in our Quality Score Tracker tool.
As the Quality Score starts to increase, the average CPC in this campaign starts to drop.

Quality Score’s Impact On Ad Rank

When Google launched AdWords Select and started to shift from CPM-based pricing to CPC-based pricing, they couldn’t afford to lose all the revenue from their CPM program (which was called AdWords at the time). They were still a pretty small company, and Yahoo/Overture was a formidable competitor. So, to ensure revenue was maximized, they ranked ads in the CPC program according to a very simple rule:
Ad Rank = Max CPC * CTR
If you take a minute to look at this more closely, you’ll quickly see that ad rank is, in fact, equal to CPM or dollars-per-impression. This was the simple but brilliant insight that made AdWords so powerful — advertisers only had to pay when they got clicks, users would see more relevant ads because ads with high CTRs were more likely to appear high in the results, and Google was making as much money as possible from these ads.
The equation for ad rank is a whole lot more complicated these days and now includes thresholds for appearing at the top of the page, landing page factors, and more. But at the heart of it, the original principle still applies: if Google can show more relevant ads, they will get more clicks, have happier users and make more money. And, the key component for achieving this is CTR.
The importance of CTR to Quality Score is a bit like the importance of TF-IDF to SEO. While there are hundreds of factors that go into ranking in paid or organic search, these long-established principles are still some of the most important ones. In the 80/20 rule, these are your 80 percent factors and the first ones you should pay attention to.

Factors Of QS

While I’ve explained that CTR is a main driver in QS, it’s useful to understand how Google thinks about CTR. After all, there are many things that influence the CTR you see in your account such as the device, the network, or the position of your ad on the page. Thus, the average CTR you see in your account is not the CTR Google uses to determine Quality Score.
To make sure advertisers have a level playing field, they evaluate small slices of CTR.
For example, they look at different CTRs by device type so that your performance on mobile won’t affect your performance on desktops. They also have a different CTR they look at for the Display Network and Google Search — a good thing, since CTR on Display is usually much lower, and you wouldn’t want that to hurt your QS for search.
Where possible, they also favor looking at the CTR when the keyword in your account matches the search query exactly (don’t confuse this with the “exact match” keyword match type), and they normalize the CTR based on the number of ads on the page and your ad’s position amongst them.
Furthermore, Google has to make some guesses before they have a statistically significant amount of CTR data for new accounts, new keywords and new ads, and they do this by evaluating the CTR at different levels as explained in the diagram below.
The various levels at which Google evaluates CTR to determine Quality Score.
As you can see, there are 3 levels of CTR evaluation: the account, the keyword and the ad. These CTR elements are all combined into a secret formula and out comes your keyword-level Quality Score and the corresponding number between 1 and 10 that you can see in your account.

How Quality Score Is Set For New Keywords

When a keyword is new in an account, there is not a strong historical element for how the keyword performs with its ad text (factor 3), so the QS is mostly based on system-wide data for that keyword in all other accounts. That gets combined with data for how this particular account and its ads have performed historically. If these elements have good QS, the new keyword is likely to also start off with a better QS.
To give an example, if you have 2 accounts, you should see a lower starting min bid in the account with the better account-level QS. If you have 2 domains, you will see a lower starting min bid when using the domain that has a better QS.
After the system gets enough data about more specific things, like how the keyword performs with the ad you wrote for it, it will rely much more on this to determine the Quality Score. This is why it’s so important to have great account structure and split up your ad groups in a way that allows you to create great performing ad texts for each grouping of tightly related keywords.

Other Relevance Factors

According to Hal Varian, Google’s Chief Economist, QS also considers “relevance” in addition to CTR. But what does that mean? The easiest way to think about this is once again based on click-through rate — but, rather than using CTR to generate the QS number between 1 and 10 that you see for each keyword in your account, it’s used at the time a user does a search to determine if there are any correlations between that user’s search and your ad that could predict the CTR (Google’s Quality Score is a predictive system that tries to predict CTR for each ad and each query). Some examples:
  1. Did the user’s search include some additional words, and do those correlate with your ad’s expected chance of getting clicked? E.g., if you have a job website and want to advertise on the keyword [jobs], your ad is probably not relevant when someone searches for “Steve Jobs.”
  2. Does the location of the user have any correlation to your predicted CTR? E.g., if your business is in the US and the searcher is in Belgium, perhaps it’s less likely your ad will get the click because the users may prefer a business closer to them.
  3. Does the time or day of week influence your predicted CTR? E.g., Google may know that users are less likely to click on your ad on a Tuesday.
These factors let Google assign you a real-time quality score which they can use to better rank your ad for that particular query. There could be many other “relevance factors,” but just know they’re all based on the same principle of trying to predict the likelihood of your ad getting a click based on something Google knows about that specific query.
While the lack of transparency into the factors may be annoying, this relevance component has helped advertisers by automatically giving them more good clicks and fewer bad ones.

Landing Page Quality Score

The landing page is one of the newer factors used for QS. Landing Page Quality (LPQ) started as a way to counteract bad sites that duped users into clicking their ads and hence had a good CTR but a lousy user experience. Now that LPQ can also improve your QS, it’s getting a lot more attention from advertisers (probably more than it warrants).
Remember, the CTR of your ads is still the bigger QS factor and probably the better thing for most advertisers to focus on optimizing. Every now and then, I hear of advertisers who are spending a ton of time creating one landing page per keyword so that the keyword will appear on the page and score a better LPQ. That’s probably overkill — Google is very good at understanding how words are related, so it’s unnecessary to include every variation on the page.
My personal recommendation is to also keep a close eye on bounce rates and time on site, two metrics you can see directly in AdWords when you link it with Analytics. A high bounce rate or very short time on site both provide a great way for you to find keywords that are not relevant in the minds of users.

Optimizing The Right Elements Of Your Account

If you haven’t guessed by now, optimizing Quality Score is really all about optimizing for CTR. The challenge is to optimize for the right CTR. For example, because Google uses position normalization when determining how your CTR impacts your QS, it could very well be that your ad with a 15% CTR in the top position on Google is actually worse than your 3% CTR ad in the last place on the right side of the page.
You should also look at the impression-weighted Quality Score to determine which keywords and ad groups are most in need of an optimization. I shared a script for automating the calculation with AdWords Scripts.

Google Adds Enhanced Campaigns Bid Adjustment Reporting To Google Analytics

Google announced today that Bid Adjustments reports for AdWords enhanced campaigns are now included in Google Analytics.
The reporting, found in the Advertising section under Traffic Sources in Analytics, are designed to help advertisers analyze the performance of each bid adjustment within a campaign — by device, location and time of day.
Google Analytics Bid AdjustmentsYou’ll notice in the Google-provided screenshot example above, there are columns for Revenue and Ecommerce Conversion Rate in the Summary view. These metrics are available when Ecommerce tracking is enabled in Google Analtyics, allowing you to analyze bid adjustment performance by ROI. However, when you look at your own reporting, you may see that the Summary view only shows goal results and that the columns for Revenue and Ecommerce Conversion Rate appear under the Ecommerce view instead.

Sunday, July 21, 2013

The Most Important KPI For A Performance Marketer

Many performance marketers continue to consider click-through rate (CTR) as a key performance indicator of their search campaigns’ effectiveness and evolve their PPC optimization strategy around that.
At the end of the day, what matters most is achieving the best ROI given your business objectives and budget, and you might optimize directly to CTR or ROI or a combination of success metrics to achieve that.
In order to have the best optimization strategy for your SEM campaigns, it is important to understand and quantify the influencers of ROI.

The Two Extreme Optimization Strategies

There are two types of strategies performance marketers consistently use as their campaign optimization strategy:
1)    Optimizing To A CTR Goal
One of the main factors influencing Quality Score (QS) is CTR, which affects your cost-per-click (CPC) and in turn affects your ROI. An increase in QS due to a boost in CTR would lower CPC and improve ROI.
CTR optimization
2)  Optimizing To An ROI Goal (Revenue-Per-Click & Cost-Per-Click)
Direct optimization to revenue or a conversion metric is a common strategy amongst performance marketers. Making sure an intelligent bid management is in use will be crucial to your campaign’s success.
ROI_GOALS1
While perhaps no marketer purely optimizes to CTR or ROI, they tend to skew towards one of these camps. Each method has its pros and cons. A CTR strategy will get you more clicks but does not guarantee the highest ROI. A purely ROI approach will get you the highest ROI but you potentially lose out on customers early in the sales funnel who might eventually convert.

ROI Breakdown

ROI equals Revenue-Per-Click (RPC) over Cost-Per-Click (CPC). Data analyzed from over two dozen advertisers using econometric methods (a simplified version of the equation is shown below) shows that 34% of ROI is influenced by RPC and 66% by CPC.
Bid management is by far the most important influencer of ROI. Forty-nine percent (49%) of ROI is influenced by bid management, 13% by other factors (i.e., marketplace, seasonality, etc.), and 4% by CTR. The data show the importance of having an intelligent bid management strategy in place for your SEM campaigns. But, does this mean a CTR maximizing strategy is a wasted effort?
ROI_MODELS1

A Deeper Dive Into The Relationship Between ROI & CTR

Previous studies have looked at the relationship between CTR & ROI by purely relying on correlations. A correlation analysis alone cannot determine the effects of CTR on ROI, and a more robust statistical technique is required to answer that question. These techniques enable us to control for all the factors that can potentially influence ROI.
From the chart below, we do see a relationship between the CTR & ROI — but not a very strong one.
SCATTERS

Applying statistical modeling techniques will allow us to quantify any statistically significant relationship between the two if it exists.
In this model, I control for position, CPC, industry, and bid management differences across the different advertisers in the data in addition to CTR.
The results show that there is a statistically significant relationship between CTR and ROI; but in terms of impact, it’s quite small. For a 10% increase in CTR, expect to see a 1.2% increase in ROI. This means that if you increase your CTR from 10% to 11% for a campaign with an average ROI of $5, the ROI will increase to $5.06 due to the improvements made in CTR.

Key Takeaways For Performance Marketers

  • Campaign managers should utilize both strategies above in optimizing their campaigns; main focus should be on ROI but do not completely ignore CTR
  • 49% of ROI is influenced by bid management; intelligent bidding is integral to a campaign’s success
  • CTR does have a small but statistically significant impact on ROI; a 10% change in CTR affects ROI by 1.2%

In Summary

Focus on optimizing your SEM campaigns for ROI but keep an eye on CTR. There is no need to purely optimize to CTR as it influences only 4% of ROI; but, it is important to account for it in your longer term strategy and make sure healthy CTR rates are met and maintained.
Intelligent bid management heavily influences ROI and is absolutely necessary to ensure your ROI goals are met.

Thursday, July 18, 2013

Google Tablet CPCs Rise 1.7% Above Desktop For First Time [The Search Agency Report]

The Search Agency issued its Q2 State of Paid Search report today, finding that overall impressions were up 19.2 percent across all search engines quarter-over-quarter (QoQ), while overall clicks declined 7.8 percent. Cost-per-click (CPC) rose across all devices.
This marks the first quarter The Search Agency has seen tablet CPCs outpace those of desktops on Google. Tablet CPCs rose 26 percent QoQ, coming in 1.7 percent higher than desktops.
Tablet CPC Discount Over Desktop Q2 Search Agency
Overall tablet clicks dropped 8 percent QoQ. Year-over-year, however, tablet clicks were up 62 percent. Bing continued it growth on tablets, increasing its share of clicks from 8.7 percent in Q1 to 10.9 percent in Q2.
Smartphone were the only device segment to see an increase in clicks QoQ, with a slight uptick of 1.6%. Smartphone ad spend leaped 25 percent for the quarter.
CPCs Rise Across Search Engines
Overall cost-per-click increased 17.3 percent QoQ and 10 percent YoY.
On Google, CPCs showed an increase across every type of device QoQ,  with the largest increase coming on tablets at 26 percent. Bing’s average CPC increased 18.9 percent YoY and remained relatively flat QoQ.

CPCs by Search Engine Q2 Search Agency

The Impact Of Enhanced Campaigns 

While reports from RKG and Covario concluded that enhanced campaigns have had little impact so far on CPCs, The Search Agency finds otherwise. The report says, “The rise in marketplace competition caused a spike in CPCs during Q2″.
The report also suggests that enhanced campaigns played a role in the relative decline in clicks QoQ compared to impressions: Declining CTR “may indicate a shift in matching or query mapping changes at the search engine level.” Google impressions rose 21.4 percent while clicks fell off 7.1 percent QoQ.
CTR dropped sharply in Google from last quarter — from 3.46 percent to 2.66 percent. However, it looks more like there was a spike in Q1.
Google Bing CTR Q2 Search Agency
Though less dramatic, Bing also saw click declines. Bing impressions rose 15.6 percent while clicks dropped 4.1 percent QoQ. Bing also saw an increase in CTR in Q1 and dropped back closer to Q4 levels last quarter.
Overall CTRs fell across devices in Q2. Desktop was off 22.6 percent QoQ, though just 3.9 percent YoY. Smartphone CTR fell 18.6 percent QoQ and 16.5 percent YoY. And Tablets saw the biggest QoQ drop, falling 21.1 percent, and 15.1 percent YoY.
Desktop Losing Share of Spend 
The Search Agency found desktop share of spend continued to fall, coming under 75 percent for the first time this quarter. Desktop 74.5 percent share of spend marks a 12.5 percent drop YoY and 2.5 percent dip QoQ.
Smartphone share of spend has risen 70.4 percent YoY and 12 percent QoQ. While tablets have increased their share of spend by 74.7 percent YOY and 4.2 percent QoQ.
Q2 Share of Spend By Device Search Agency

Mobile Efficiencies Still High On Bing

While Google CPC efficiencies compared to desktop are falling for both smartphones (11.3 percent down from 14.1 percent in Q1) and tablets (now 1.7 percent higher than desktops), there are still sizeable discounts on Bing. Bing smartphone CPCs were 28.3 percent lower than desktop in Q2 (way up from 16 percent in Q1), and Bing tablet CPCs are off 7.7 percent compared to desktops. That’s up from 5.2 percent in Q1.
The Search Agency sees device adoption on Bing continuing to grow and suggests there is a particularly strong opportunity to add tablet campaign on Bing. Overall they suggest adopting a consistent mobile strategy to better understand consumer search behavior and increasing clickshare on tablets and smartphones.

Wednesday, July 10, 2013

Are Google’s Results Getting Too Ad-Heavy & Self-Promotional?

Are Google’s search results getting too ad-heavy and leading back to Google’s own content too much? A new blog post suggesting that Google’s non-paid listings make up only a tiny fraction of the entire search results page has sparked some discussion, though the exact percentage actually varies on how you count what’s on the page and from query-to-query.
According to the blog post by Aaron Harris, co-founder and CEO of Tutorspree, organic search results — listings that are not paid ads but ranked highly because Google thinks they are the best answer to a query — made up from 0-to-13% of a Google search results page.
However, if you measure the page not by pixel count but by actual listings, the situation is brighter than some of the “death of organic listings” proponents might think. Also, some things considered to be “Google” listings might not make sense to count that way.
Here’s what Harris found, along with some further analysis.

Auto Mechanic: Only 13% Unpaid?

When performing a Google search for “auto mechanic” using his Macbook Air with a 13-inch screen, Harris discovered that AdWords paid listings took up 29% of the page (12% at the top and another 17% to the side). The Google navigation bar took up 14% of the page. Unpaid “organic” listings got 13%, with the Google map plotted with local results having 7%, as illustrated below:
Tutorspree Blog — How Google is Killing Organic Search
Vignesh Ramachandran at Mashable experienced similar results when he performed his own test on Google. Using the same search term as Harris — “auto mechanic” — Ramachandran found that organic search results only accounted for an estimated 13.5 percent of screen real estate on his 15-inch MacBook Pro in a Firefox browser:
mashable organic search result test

Caveats & Counting Issues

Two sources coming away with a 13% figure for unpaid listings can sound pretty low. But that’s not the same as being able to declare that all searches are this way. Each search may have a different mixture of paid and unpaid results, based on the ads competing to appear, the location of the searcher and whether Google itself determines if a particular query deserves to be ad-heavy or not.
Beyond the variation from search-to-search, how you measure the percentage of a page that’s deemed “unpaid” isn’t as clear cut as it may seem.
One immediate caveat is the assumption that the map is somehow not worth counting in as “organic” listings. Clicking on the map leads to a page that will have both organic listings and paid listings plotted on a map. There’s a usefulness for search engines to show local information on a map. Arguably, some of the map “percentage” should count into the organic listings.
Another issue is the idea that the search box and navigation links should be somehow counted against Google as some type of new attempt to drive more traffic to Google products. Google’s long had navigation links. In fact, at some points, the navigation and search box unit might have been larger than it is now.
Beyond that is the idea that measuring in pixels is somehow the correct way to go. It assumes that the entire page is seen and interacted with in the same way. It also, oddly, counts the ads on the side as having nearly twice as much space as they actually take-up, because the box around them includes a bunch of white space.
Traditionally, what has concerned search marketers worried about Google (or any) search engine encroaching on the organic space has been to count the actual number of listings, especially those in the middle of the page, where people typically focus their attention and clicks.
By those measures, the example above works out to have 10 listings that are fully visible, with percentages like this:
  • Total paid versus unpaid: 70% to 30%
  • Paid versus unpaid, middle column: 50% to 50%
Those percentages are much better than the “13%” you might come away with from the original blog post. But then again, they still feel pretty low.

Meanwhile, Over At Bing…

For comparison sake, I ran the same search on my own MacBook Air with a 13-inch screen at Bing:

I didn’t try to measure the pixel count, because as explained, I’m not sure that’s the right approach for various reasons. But at-a-glance, it’s pretty clear that an ad-heavy page isn’t just a Google problem. In this example, Bing manages to push all but a single organic listing to the bottom of the page — and only the title of that one shows.
Like Google, the map leads you to a mixture of paid and unpaid listings. Unlike Google, selecting the local listings that appear next to the map sends you back into Bing Maps rather than to the actual business. Google used to do the same but changed this practice about a year or two ago, after criticisms.

Italian Restaurant: Only 7% Unpaid?

For another search, organic listings won even less screen real estate. When Harris looked for “italian restaurant,” the newly introduced Google Local Carousel located at the top of the page garnered a full 30% of the screen real estate.
With the navigation bar still taking 14%, AdWords at 9%, the Google map with 15%, a Google-owned Zagat listings (outside of the carousel) at 4%, organic search results for Harris’s search made up for only 7% of the page:

Again, that’s a shockingly low number at first glance. But, it gets better when you understand more about how the search page actually works.
The carousel links aren’t paid listings. Clicking on them leads to a fresh search results pages for the particular restaurants that are listed. The downside is that, as with Bing, this drives people back into Google rather than over to the restaurants themselves.
That’s disappointing. Google’s goal here is that the carousel is part of its Knowledge Graph, where it’s trying to share answers and information about things, including restaurants. But if someone clicks on the name of the restaurant, there’s a good assumption they just want to go to that restaurant’s page, not get stuck in an endless loop of Google search results.
As said, Google changed how its map results did this in the past; hopefully it will reconsider how the carousel works.
Another issue is counting the Zagat listing separately from the overall “organic” figure just because it’s a Google-owned property. Google asserts those properties are competing with all other pages and only appear if its algorithm believes they are relevant. There’s no programmatic command to always show a Zagat page at the top. Some won’t believe this, of course. But still, that’s far different than the assumption that a Zagat page might always show.
Indeed, here’s what I see in my location for the same search:

In this case, I don’t get any ads at all. I also don’t get any Zagat listings. Instead, I get the Olive Garden, an LA Times article and two listings from Google-competitor Yelp.

Meanwhile, Over At Bing…

On the one hand, I’m much happier with what I get from Bing:
There are ads, but they are over in the middle column, under the map. Clicking on the main listings takes you to the restaurants, unlike how Google’s carousel works. Organic search is far from “dead” here.
Then again, Google’s giving me a more colorful display that actually lists more restaurants than Bing does. If the carousel took me directly to those restaurants, rather than back into the search results (where you can then get to them), I think it would be a much better winner.
A final caveat in all this. Looking at a page doesn’t help you understand some of the interactivity that goes on. With Bing, selecting the “Reviews” link changes the middle column into showing more information from Bing’s own sources. How that gets measured is another complication, if we’re counting pixel space versus listings.

0% On Mobile?

Organic search results fared even worse in mobile searches, claiming 0% of the initial screens. When Harris searched “Italian Restaurants” from his iPhone, he had to scroll through four full screens before seeing any organic listings, which appeared after ad units, Google-owned Zagat listings, and a Google map followed by Google local listings:

Again, it sounds terrible until you get into the caveats. First, there’s the counting of Zagat in the first example as not being an organic search results, when it is. That really makes the results on that page 50/50 paid versus organic, unless you assume based on one search that Zagat will always occupy the top spot and that there will always be an ad. That’s not the case for me, in my location. In my area, Yelp has the entire page first screen.
After that, I get the same type of Google local listings as shown as “2″ in Harris’s example. I suppose that’s bad news for the Yelps of the world who want even more of that page, and it really does illustrate what Harris said, something the Yelps and others have already themselves said many times before:
“If you compete with Google in any way, you’re in its crosshairs. Your chances of ranking high enough to garner traffic are virtually nil and getting smaller.”

Life Harder For Competing Search Engines; Not Necessarily For Web Sites

Indeed. While the future may not be as bad as Harris paints it for other local search providers, in getting traffic from Google, the trend is pretty clear. Where Google can provide answers, it’s going to do that more and more directly, rather than feeding out to competing search engines.
That, however, isn’t necessarily bad for the user. If I’m on my phone, and I want to learn about a restaurant, the Google local results in the second screenshot are extremely useful, offering to let me call the restaurant or get directions to it. If I drill in, I’d even get an Urbanspoon menu. I’d also likely get Yelp reviews along with Zagat reviews, if that’s what Yelp wanted. But that’s not what Yelp wants, because Yelp blocks those reviews from appearing in Google.

But Google Owning Content Is Troubling

For me, the concern isn’t that Google doesn’t show enough listings of other search engines, any more than I’m not concerned that the New York Times doesn’t run enough Wall Street Journal articles.

To me, the real concern has been the transformation of Google from being a search engine that pointed out to destination sites (like those restaurants) to wanting to be a destination of its own.

SEO and organic search is far from dead, and anyone who runs a site can look at their traffic logs to know how much traffic Google sends them every day, for free. But selling movies, offering restaurant reviews, hosting video, hosting book content and more does further pollute the clarity we used to have about what Google’s role was as a search engine, and whether it pushes its own content above others.

Monday, June 24, 2013

New top movers report to track how your ad performance has changed

Many of you start each day by asking: What is driving a change in my clicks or cost? What campaigns or ad groups saw the the largest moves? Did any of my recent changes break something?

To help answer these questions, Adwords created the top movers report to show you which campaigns and ad groups have experienced the largest changes in clicks and cost, and highlight changes you made which might have contributed to those moves. Even if your overall account performance metrics appear unchanged, the top movers report will look inside your campaigns to highlight big moves that might have been easily overlooked.

How it works
To view the top movers report, click the Dimensions tab, then View: Top movers. The report compares performance for two consecutive time periods of equal length, and finds the campaigns and ad groups that experienced the largest change between the two periods. You can compare periods of 7, 14, or 28 days, or look at reports generated in the last 90 days.

The report will start by finding up to 10 of the largest moves in clicks or cost and present a summary at the top. If a top mover saw an increase, it goes into the “Top increases” category. If it’s a decrease, it goes into the “top decreases” category. When changes aren’t significant enough to be a top mover, they will roll up into “Other changes.”


The table below will give details for each top mover. When possible, we offer a “possible cause” for the move, like “bids were increased” or “new keywords were added”.


Note that “possible causes” only considers changes made to your account. It won’t tell you, for example, if your competitors have raised their bids or introduced new ads.

Top movers is our latest effort to save you time and money by helping you understand changes in performance.  For additional information about using this new report, visit the AdWords Help Center.

Tuesday, June 18, 2013

Give your sitelinks additional detail in enhanced campaigns

Ads that provide detail and precision can help people make more informed decisions.  Sitelinks help people find information deeper in your site so they can get to where they want to go faster.   In February 2012, Google improved sitelinks by using text from other ads in your account or My Client Center to create sitelinks with additional detail.  Today, Adwords going one step further by enabling you to nominate specific text for your sitelink descriptions from within your AdWords account.  This will allow you to control the descriptions that display when this sitelink format shows.


In testing, users have reported that sitelinks with additional detail were more useful and relevant, and clickthrough rates were significantly higher than the same ad with traditional 2- and 3-line sitelinks.

The new sitelink format with additional detail is available only in enhanced campaigns.  Enhanced campaigns enable you to reach people with the right ads in the right context - location, time of day and device type -  without setting up and managing numerous campaigns. All campaigns will be upgraded to enhanced campaigns on July 22nd.

After upgrading to enhanced campaigns, you will have the option of adding extra text to your sitelinks - simply fill out both lines of the "Description" field when creating a new sitelink or editing an existing sitelink.


Note that your ads won't always show sitelinks, and when they do, the format that appears could vary.

The core guidelines for sitelinks remain the same with these improvements:
  • Sitelinks cannot violate the duplicate sitelink URL policy
  • Sitelink text cannot use keyword insertion
  • Sitelink text cannot be the same as other sitelinks in the same ad group/campaign or the main ad that’s serving
  • In addition to this 4 sitelink view, there is also a 2 sitelink variation

Wednesday, June 5, 2013

New Image Extensions Enable You to “Show” and “Tell” with Search Ads

Advertisers understand that sometimes it's easier to 'show' rather than 'tell' when promoting a business. As search ads continue to evolve, Google want to make it easier for you to do both. Today Google announcing the beta launch of image extensions, which will allow you to add new visual elements to your search ads.  Adwords added many extensions to search ads to help you be more relevant to users.  Image extensions enable you to more accurately convey the body style of a car, the cut of a pair of jeans, or a particular shade of eyeshadow, making your ads richer and more informative so they stand out in a crowded marketplace.


As the web evolves, Google users expect richer and more diverse content. More than one in six searches on Google today provide results with visual content. Image extensions will show in some cases when we determine that a search is likely for visual content. For example, it is more likely that your image extensions will show for a query like luxury car designs than locations of nearby car dealerships.

You can choose the images that you want displayed with your search ads and send them to Adwords Team for review.  You must have the necessary rights to the the images you wish to display with your ads.  Adwords encourage you to submit your images as they continue to experiment with and improve visual ad formats.
Image extensions are currently running in English globally.

Monday, May 13, 2013

How To Conduct Ad Tests In Enhanced Campaigns

Enhanced campaigns have brought about many changes to AdWords. One of the biggest changes yet to be discussed is the fact that your ad testing methods will have to change.
One of the “features” of enhanced campaigns is that your campaign can now run on desktops and mobile devices with different CPCs that are controlled by bid modifiers. However, since your ads can be run on multiple devices at the same time, you need to test your ad metrics by device.
This can easily be accomplished with device preference and Excel filters. First, let’s discuss why this change needs to occur, and then, how to control the ad serving to ensure you are testing your enhanced campaign ads properly.

Why The Testing Change?

Let’s say we’re testing two ads and that we’re running both ads on all devices (desktops/tablets and mobile devices). What happens is that after a while, we check our metrics and we see data that looks like this:
sel1
If you simply used this data as-is, you would assume that Ad 1 is the best ad overall and go with that ad.
However, averages hide all the useful data. You need to segment your data to truly understand what is happening. If you were to segment these two ads by device type, the data looks much different:
sel2
In reality, Ad 1 is not the best ad — it is the best ad on mobile devices. The best ad on desktop devices is Ad 2.
Therefore, you’d now want to control which ad shows on which device, and this can be accomplished with device preferences.

Device Preferences

When  you create a text ad, you can specify the device preference:
Google Enhanced Device Preference
If a campaign is set to show on all devices, and you have not set a preference by ad, your ads will be shown on all devices.
If a campaign is set to show on all devices, and all your ad preferences are set to mobile, your ads will be shown on all devices.
To control the ad serving by device, you need both a mobile preferred ad and a non-mobile preferred ad in each ad group. To test ads by devices, then you need at least two mobile preferred ads and two non-mobile preferred ads in each ad group.

Image Ad Preferences

In “legacy” campaigns, most sophisticated accounts would segment their display advertising from their search ads, and their mobile display campaigns from their desktop display campaigns. Because these campaigns were already segmented by device, most marketers would just upload “mobile” ads to their mobile campaigns and desktop sizes to their desktop campaigns based upon Google’s sizes:
sel4
However, several of the sizes that are not traditionally considered mobile ad sizes can be shown on mobile devices:
sel5
Therefore, you will also want to specify the mobile preference of an image ad so that you can test your image ads by devices as well as your text ads.

An Easy Way to Determine Ad Types by Device

In the AdWords interface, it is not easy to see if you have a mobile and non-mobile preferred ad in each ad group. The easiest way to see this data is to use a pivot table and conditional formatting.
In this case, a simple pivot table was used to show the number of ads by device preference in each ad group; and then, conditional formatting was applied to highlight any cell that was less than 1.
sel6
If you wanted to make sure you were testing in each ad group, you could also highlight all cells with less than 2 ads using conditional formatting. This would allow you to see which ad groups need ads created so that you can test them.

Run Your Statistical Confidence Numbers As Normal

Once you have the ads set up and running by device, you can do your statistical confidence calculations and pick your winner — just make sure to segment the information by device.
Only use your mobile information to test your mobile ads and pick winners.
Only use your desktop information to test your desktop ads and pick winners.
Once the data is segmented by device, the way you run your numbers and pick winners will not change with enhanced campaigns.

A “Cheater’s” Way Of Testing

Creating thousands of new ads can be a daunting task — so, there is a shortcut you can use. However, please note that, as with any shortcut, there are some underlying weaknesses.
Instead of creating ads for every device type, if your landing pages have the same content (such as with responsive design) and if overall conversion actions by device are the same, then you can start with just ads on “all” devices. You can then segment the data by device type and run your statistical confidence by device.
Once you have a winning ad by device, then you can change the ad’s preference type of mobile if it’s a mobile winner and leave the desktop winners as all devices.
There are a few inherent weaknesses to this approach:
  • You cannot customize the call to action by device
  • When you “edit” your winning mobile ad, it must go back under review and the stats are “reset” for the ad
This isn’t an ideal long term solution; but, if you are trying to transition many campaigns and thousands of ads to mobile devices, it can be a way to start ad testing.
However, with a “good” transition, you will keep your mobile ads in your enhanced campaign by moving the mobile ads to your desktop campaigns (or vice versa) and using ad preference to keep them segmented.

Wrap-Up

Enhanced campaigns are a major change to managing AdWords. However, they do not change the underlying principles of ad testing. You must test ads — and a good ad test will not only examine the differences in multiple ads, it will also take into account segmented data such as the device where the ad was displayed.
By ensuring you are controlling your ads displayed by device type, you can be confident in your ad tests and ensure that you are keeping the best ad for your account.
Even with device segmentation, many of the previous columns on ad testing are still true – they just require a previous step – device ad control. You can still easily manage and test millions of ads and use cross ad group testing principles.

Monday, April 29, 2013

Before You Quit Pay-Per-Click, Follow These PPC Tips

The thought of advertising your small business is both exciting and unnerving.  Many business owners are proactive when it comes to marketing their own business, using pay-per-click (PPC) advertising for instant results. When business owners try to handle their own PPC ,  they can spend  hundreds or even thousands of dollars on pay-per-click advertising  only to see little return on their investment.
Before you give up on PPC, consider the common mistakes that business owners make when managing their own advertising campaigns:
  1. Having Unrealistic Expectations
  2. Not Checking the Terms They are Actually Paying For
  3. Not Adding Negative Keywords
  4. Creating Ads Without Keyword Relevant Landing Pages

Having Unrealistic Expectations

Small business owners need to be broken out of the traditional advertising mindset.  For years, small business owners advertised on printed media, radio, and television. They are used to seeing and hearing their own ad constantly.  With  PPC advertising,  your ad will not be up 24 hours a day, 7 days a week. Often, business owners will set up a PPC campaign, search their keyword, and not find their ad. When this happens, their first thought is, “Where is my ad? This is not working!” PPC is a lot different than traditional advertising.  You pay for performance.  
There are a few reasons why you might not be seeing your ad:

  1. Your ad  might have already been clicked on a few times today. Once you reach your daily budget, your ads will stop running for the rest of that day.
  2. You may be targeting too many keywords or not the right keywords.  In general, the more specific the keyword, the better the results. See my post on longtail keywords.
  3. Your daily budget may be too small. If your spending less than $10 a day, your budget might not be enough to provide meaningful results.

Not Checking the Keyword Details (Query String Report)

When I have talked to small business owners that manage their own PPC, I was surprised to learn how few people actually use this. The keyword details are the actual search terms that you paid for. You can also think of this as keywords driving traffic.  Lots of valuable information can be found in this report. You can quickly see if you are wasting money or may see opportunities for new keywords. Hands down, this is my #1 PPC tip.
Here is how you can see the query string report:
PPC Keywords
Click on the keywords tab.
Select all keywords to see every search term that you paid for.
See ppc keyword details
Click on view keyword details.
Look for keywords that will never result in new business and add them as a negative keyword.
See which search terms are actually driving traffic. Notice that this list doesn’t exactly match your keyword list. Look for keywords that will never result in new business and add them as a negative keyword.

When you look through this report, you should ask yourself one question- could this search term result in business?
For example,  I was recently looking at a PPC campaign for a maid service company. One of their targeted keywords was “housekeeping.” I looked at the query string report and I saw that she had a lot of traffic coming from people searching for “housekeeping jobs.” The business owner was paying for this traffic and didn’t even know it. I also found something rather amusing.  One of the search terms was “arnold schwarzenegger housekeeper”. I am not sure why a person searching for this ended up clicking on an add for maid service; perhaps it was an accident. Anyways, after I checked the query string report, I added 71 negative keywords to this campaign. One was “jobs” and the other was “arnold schwarzenegger”. with the addition of negative keywords, the business owner does not have to worry about paying for these terms that will won’t result in a sale.

Not Adding Negative Keywords Every Month

This is somewhat repetitive to the step above, but it is so important I wanted to break it out into its own section.  Negative keywords are terms that you don’t want to advertise for.  This is almost as important as choosing the words you do want to advertise for.
Let me illustrate with an example. If you own a carpet cleaning service, you might have “carpet cleaning” and “cleaning service” as keywords. Without negative keywords, someone searching for “window cleaning service” might see your ad and call you to find out that you don’t offer window cleaning.  Not only is this annoying for both the customer and the business owner, it also eats up your PPC budget.
Many small business owners running their own PPC campaigns don’t create a negative keyword list.  PPC platforms like Adwords and adCenter are designed for anyone looking to get started ASAP. There are few requirements in the actual interface. You need a budget, some keywords, and an ad with a landing page.  Because negative keywords are not required, most small business owners don’t set them up. Adding negative keywords will make your campaign much more effective by spending your budget only on keywords that will drive  new business.

Creating Ads Without Keyword Relevant Landing Pages

One of the biggest mistakes is not having the actual keyword you are targeting on your landing page. For example, say you are an HVAC company. You have a home page that talks about your company with some marketing language about “why choose us.”  You want to advertise your business when people search for “Water Heater Repair In Houston,” but no where on your home page do you have those keywords in that order. This is like shooting yourself in the foot. If you want to get results for this keyword, this is how you should up your campaign:
  1. Sign into Adwords and create a campaign. Set your daily budget and target your ads to be shown in Houston.
  2. Create an ad group called water heater repair.
  3. Add keywords specifically about water heater repair (water heater service, water heater not working, broken water heater, etc.)
  4. Add negative keywords related to this service (jobs, etc)
  5. Create ads specifically about water heater repair.
  6. Create a landing page specifically about water heater repair using the keywords from step 3.
Follow the above tips to get the most out of  your PPC, increase conversions, and drive potential customers to your website. You’ll enjoy the boost to your bottom line that a properly executed PPC campaign can create!

Tuesday, April 23, 2013

New Upgrade Center For Enhanced Campaigns Lets Advertisers Do Bulk Upgrades & More

Google AdWords is rolling-out a new upgrade center today for advertisers using Enhanced Campaigns. Accessible from the left-hand nav bar on the Campaigns tab, the upgrade center lets advertisers managing several campaigns perform bulk upgrades to multiple campaigns simultaneously and merge selected campaigns in a few simple steps.
Enhanced Campaigns Upgrade Center
The bulk upgrade feature allows advertisers to select multiple campaigns, choose a mobile bid adjustment, view traffic estimates and upgrade their Enhanced Campaigns with fewer clicks, making it easy to upgrade individual campaigns all at once.
The upgrade center also identifies search-only or search+display campaigns that have similar keywords and location targets, and offers a preview of possible campaigns that could be merged. Advertisers can then adjust the proposed settings, ad groups and extensions for merged campaigns.
Enhanced Campaigns Upgrade Center merged campaigns
Google notes that ad groups and budgets will be combined by default, and any campaign level settings and extensions in the Primary campaign will override Secondary campaign settings and extensions.
According the Inside Adwords blog, the upgrade center will roll-out to advertisers over the next few weeks.

Like Us on Facebook