Pages

Showing posts with label bidding. Show all posts

Monday, January 27, 2014

AdWords Bid Management And Account Structure Mistakes To Avoid

On my one-year anniversary of working as an AdWords practitioner instead of a Googler, Brad Geddes interviewed me about Quality Score for his WebmasterRadio.fm show, Marketing Nirvana. He asked for my thoughts on AdWords now that I’m a user rather than someone building it, and I thought that was a great question and one worth covering in this month’s column.

I’ve always had plenty to say about the most common mistakes advertisers make, but now that I’m auditing accounts more in-depth and managing a few myself, there are some new mistakes I’ve seen that I think are worth sharing so that you can avoid them in your own accounts.

Bid Management Pitfalls

Handing the reins of bid management to Google or another third party has risks — but perhaps not for the reason I so often hear, which is that Google could use the information to their own advantage. I believe Google wants to use the information to give advertisers the results they want, and I am a big advocate of automated bid management because doing lots of repetitive math and keeping track of lots of variables is something computers are simply better at than your average account manager.

Automating bids is especially useful when you’re working with large accounts; any time you have more than a couple hundred keywords, managing all these manually is just too slow and tedious. But relinquishing all control to the algorithms can have unintended consequences, and it’s useful to understand the risks so you can decide what’s right for your account.

Monitor Your Top Keywords’ Bids Closely

An advertiser I was working with noticed that they lost pretty much all conversions on the one keyword that perfectly describes their business. This happened several months ago, and because they were spending so much time managing long-tail keywords, the drop-off on their money keyword initially went unnoticed.
Be careful about what automated bid management  does to the bids of your top keywords. Here a keyword was bid down from the first page.
Be careful about what automated bid management does to the bids of your top keywords. Here a keyword was bid down from the first page.

Only much later (during my audit) did they learn that this keyword had seen a week of poor conversion performance following a landing page redesign. The algorithm noticed it, too, and dropped the bid 60% — effectively taking them off the first page of results. They noticed the conversion rate decrease and quickly fixed the landing pages, but they never looked at resetting the bids for their keywords, so it continued to linger on page 2 of the results. Had the bid algorithm given the keyword another chance, it would have been restored to the first page of results and they wouldn’t have lost a ton of sales.

The takeaway here is that it makes sense to manage head keywords differently than long tail keywords. Even if you put them on automated bidding, you must monitor these keywords closely so that any change in performance will trigger a warning and you can investigate.

AdWords could make this much easier if they allowed advertisers to add charts of keyword-level detail to the interface. Until that time, we have an AdWords Script that builds a nifty little AdWords dashboard in Google Sheets.
optmyzr dashboard output example
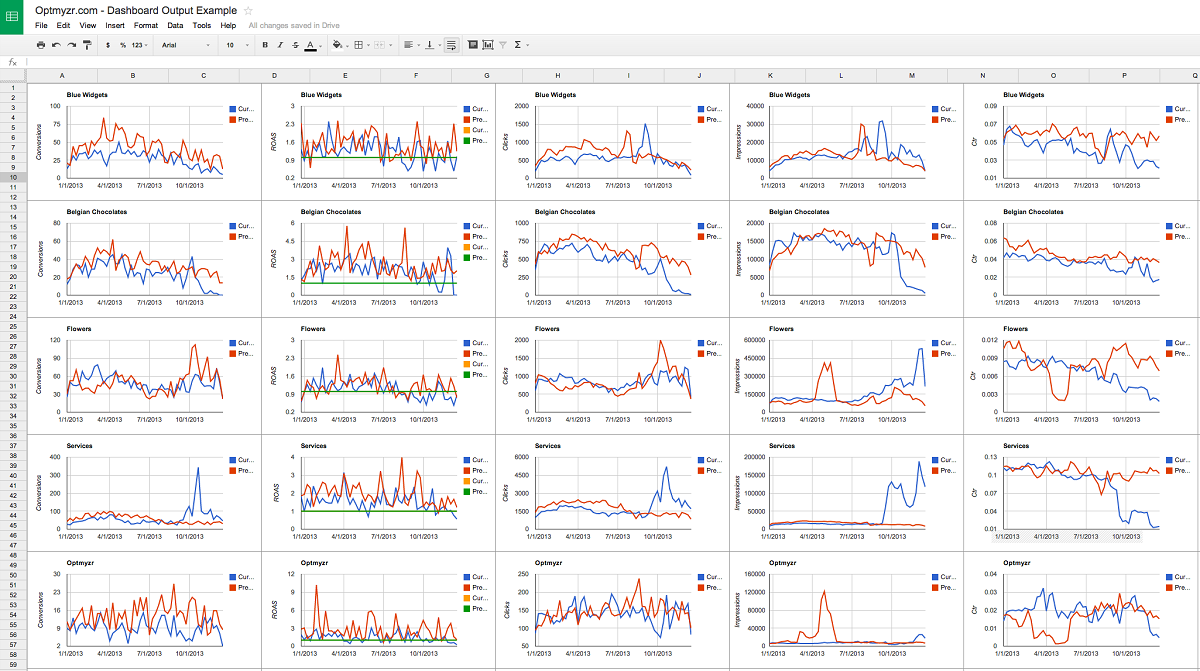
Build a dashboard for any campaigns, ad groups or keywords in your AdWords account in minutes using an AdWords Script.

Changing Bids Can Change Which Keyword Is Served

The second issue with bid management is that your carefully calculated bids may not be the ones Google actually uses. Because of the vagaries of how Google selects the keyword from your account that matches the query, it’s possible that lowering the bid on a poorly performing keyword simply shifts its clicks to another keyword that still has a higher bid. This is exactly why we built the Traffic Sculptor – it helps find when Google gives an impression to a different keyword than what you intended. This way, you can be sure Google is serving the ad for your selected keyword, using its bid, ad text and carefully selected landing page.

Budget Constrained Campaigns May Not Work With Automated Bids

A third pitfall I’ve noticed with managed bids is that they may not always play well with budget constrained campaigns. On several occasions, I’ve seen that a campaign that uses bid automation depletes its budget too early in the day, even when ad serving is set to standard (meaning that ads are supposed to be shown throughout the day). Obviously, when the budget runs out by 10:00 a.m. and no conversions happen, it creates a potential vicious cycle — the bid management tool will eventually reduce bids too much and the campaign may entirely miss serving ads at the times of day when they would have performed best.

Account Structure Issues

Another common problem I’ve noticed is with account structure and keyword match types. I still come across accounts that combine display and search in a single campaign and accounts that have hundreds of keywords in an ad group — both not best practices in AdWords.

But one account structure issue that’s a bit more subtle (and that I hadn’t given much thought until this year) is that if you’re deploying a lot of broad match keywords in an account, it’s challenging to see trends or answer questions about why results change. That can make it hard to know if your strategy is panning out. As much as I like broad match keywords for their ability to help discover what users are really typing into the search box, they can make life for advertisers pretty hard….

Broad Match Keywords Are Liars

We’ve all heard that CPCs change based on seasonality or because Google introduces things like Enhanced Campaigns. But knowing how this impacts your account is trickier than just taking a look at the average CPC. The reason is that most advertisers use some degree of broad match keywords in their accounts, and stats for broad match keywords are averages that include data from each of the hundreds of queries that matched the broad keyword. We’ve all heard the adage that averages lie, and broad match stats are averages that obscure what’s really happening.

For example, when you change the bid for a broad match keyword, you’re changing the query mix because it becomes eligible for a different set of queries. The different queries have different CTRs, conversion rates, etc., so it quickly becomes a nightmare to figure out why a keyword’s performance has changed. Was it a competitor, a change Google made, an optimization you did, or simply the fact that your query mix changed? If your results are dropping and you can’t pinpoint the reason, it’s hard to correct the course. So unless you’re analyzing exact match keywords, you’ll have to dig very deep into the search terms report to try and come up with an answer.

To further complicate things, even exact match keywords may see sudden changes in performance because of the aforementioned issue where Google may shift the clicks to another, similar keyword with a better rank. In this case, the best way to understand what’s happening is to run a query report rather than a keyword report.

Wednesday, September 18, 2013

Google Adds Conversion Estimates To AdWords Bid Simulator

Bid Simulator, the AdWords tool that shows click, impression and cost estimates, now includes conversion predictions
.
The Bid Simulator displays estimates for both 1-per-click and many-per-click conversions you might have received with different bids. As with the other estimated data, the conversion estimates are based on clicks from a recent seven day period.

Adwords Bid Simulator Convrsion Estimates

So far, conversion estimates appear to be very limited to high volume keywords. Many accounts may see conversion estimates in the Bid Simulator only for brand keywords. Sparse conversion data clearly makes it hard to make any worthwhile predictions about future performance. Conversion estimates on brand keywords aren’t likely to be useful if the bids are already maxed out (as in the example above).
For those accounts with high converting non-brand keywords, the conversion data could be a helpful signal in determining to whether to test different bids.

Thursday, July 25, 2013

Quality Score Explained by former Google Employee

With the continuing expansion of ad space at the top of the page (from ad extensions like sitelinks with descriptions), it’s more important than ever to make sure your ads have a great ad rank. But CPCs are on the rise – so unless you can improve your conversion rate so you can increase bids, Quality Score (QS) optimization may be your only way to maintain a high rank without breaking the bank.
While I’ve been a panelist representing Google in Quality Score sessions at more conferences than I can remember, I’ve been meaning to put together some of my insights on the topic for a broader audience. So, here goes….

The Evolution Of Quality Score

Even if you don’t care much for a history lesson, it may help paint a picture of why QS exists in the first place, and the evolution of factors may give you some insight into what Google cares about.
When I started working at Google in 2002, Quality Score didn’t exist. But what set Google apart from the other PPC ad systems at the time was how they determined if ads were relevant enough to warrant an impression. In addition to having a team of humans reviewing all ads, the system was also monitoring the click-through rate (CTR) of every keyword — if a keyword’s CTR fell below 0.5%, it would become disabled for poor relevance. Google was using the wisdom of the crowds to let its users determine which ads should show and which shouldn’t.
The problem with disabling keywords at an arbitrary CTR level was that advertisers were unhappy to see some of their keywords disabled forever (unless, of course, they knew of the workaround to resubmit the same keyword with different capitalization). So, we started to evolve the system. Instead of disabling keywords, we came up with new statuses like “slowed,” “in trial” and “on hold.”
The idea was to give advertisers a way to fix low-relevance keywords by giving them a small allowance to run ads that were considered poor quality so that they might prove otherwise. We also gave the system more flexibility so there wasn’t a hard cutoff at the 0.5% CTR level. Ultimately, though, most advertisers still saw keywords they really wanted to advertise on get disabled, and they remained displeased.
Google addressed this with the introduction of the minimum bid. Rather than flat out disabling keywords, they asked advertisers to pay more for keywords that had low relevance — the idea being that eventually, it would make no sense for an advertiser to keep paying the high cost-per-click (CPC), and they’d either optimize the relevance or delete the keyword.
In today’s system, the minimum bid has been engulfed by the first page bid, which also takes into account competition. It’s a little harder to see the direct correlation between what you pay and the quality score, but the connection’s definitely there.
Below is an example of where we see the correlation between the average CPC and the QS in our Quality Score Tracker tool.
As the Quality Score starts to increase, the average CPC in this campaign starts to drop.

Quality Score’s Impact On Ad Rank

When Google launched AdWords Select and started to shift from CPM-based pricing to CPC-based pricing, they couldn’t afford to lose all the revenue from their CPM program (which was called AdWords at the time). They were still a pretty small company, and Yahoo/Overture was a formidable competitor. So, to ensure revenue was maximized, they ranked ads in the CPC program according to a very simple rule:
Ad Rank = Max CPC * CTR
If you take a minute to look at this more closely, you’ll quickly see that ad rank is, in fact, equal to CPM or dollars-per-impression. This was the simple but brilliant insight that made AdWords so powerful — advertisers only had to pay when they got clicks, users would see more relevant ads because ads with high CTRs were more likely to appear high in the results, and Google was making as much money as possible from these ads.
The equation for ad rank is a whole lot more complicated these days and now includes thresholds for appearing at the top of the page, landing page factors, and more. But at the heart of it, the original principle still applies: if Google can show more relevant ads, they will get more clicks, have happier users and make more money. And, the key component for achieving this is CTR.
The importance of CTR to Quality Score is a bit like the importance of TF-IDF to SEO. While there are hundreds of factors that go into ranking in paid or organic search, these long-established principles are still some of the most important ones. In the 80/20 rule, these are your 80 percent factors and the first ones you should pay attention to.

Factors Of QS

While I’ve explained that CTR is a main driver in QS, it’s useful to understand how Google thinks about CTR. After all, there are many things that influence the CTR you see in your account such as the device, the network, or the position of your ad on the page. Thus, the average CTR you see in your account is not the CTR Google uses to determine Quality Score.
To make sure advertisers have a level playing field, they evaluate small slices of CTR.
For example, they look at different CTRs by device type so that your performance on mobile won’t affect your performance on desktops. They also have a different CTR they look at for the Display Network and Google Search — a good thing, since CTR on Display is usually much lower, and you wouldn’t want that to hurt your QS for search.
Where possible, they also favor looking at the CTR when the keyword in your account matches the search query exactly (don’t confuse this with the “exact match” keyword match type), and they normalize the CTR based on the number of ads on the page and your ad’s position amongst them.
Furthermore, Google has to make some guesses before they have a statistically significant amount of CTR data for new accounts, new keywords and new ads, and they do this by evaluating the CTR at different levels as explained in the diagram below.
The various levels at which Google evaluates CTR to determine Quality Score.
As you can see, there are 3 levels of CTR evaluation: the account, the keyword and the ad. These CTR elements are all combined into a secret formula and out comes your keyword-level Quality Score and the corresponding number between 1 and 10 that you can see in your account.

How Quality Score Is Set For New Keywords

When a keyword is new in an account, there is not a strong historical element for how the keyword performs with its ad text (factor 3), so the QS is mostly based on system-wide data for that keyword in all other accounts. That gets combined with data for how this particular account and its ads have performed historically. If these elements have good QS, the new keyword is likely to also start off with a better QS.
To give an example, if you have 2 accounts, you should see a lower starting min bid in the account with the better account-level QS. If you have 2 domains, you will see a lower starting min bid when using the domain that has a better QS.
After the system gets enough data about more specific things, like how the keyword performs with the ad you wrote for it, it will rely much more on this to determine the Quality Score. This is why it’s so important to have great account structure and split up your ad groups in a way that allows you to create great performing ad texts for each grouping of tightly related keywords.

Other Relevance Factors

According to Hal Varian, Google’s Chief Economist, QS also considers “relevance” in addition to CTR. But what does that mean? The easiest way to think about this is once again based on click-through rate — but, rather than using CTR to generate the QS number between 1 and 10 that you see for each keyword in your account, it’s used at the time a user does a search to determine if there are any correlations between that user’s search and your ad that could predict the CTR (Google’s Quality Score is a predictive system that tries to predict CTR for each ad and each query). Some examples:
  1. Did the user’s search include some additional words, and do those correlate with your ad’s expected chance of getting clicked? E.g., if you have a job website and want to advertise on the keyword [jobs], your ad is probably not relevant when someone searches for “Steve Jobs.”
  2. Does the location of the user have any correlation to your predicted CTR? E.g., if your business is in the US and the searcher is in Belgium, perhaps it’s less likely your ad will get the click because the users may prefer a business closer to them.
  3. Does the time or day of week influence your predicted CTR? E.g., Google may know that users are less likely to click on your ad on a Tuesday.
These factors let Google assign you a real-time quality score which they can use to better rank your ad for that particular query. There could be many other “relevance factors,” but just know they’re all based on the same principle of trying to predict the likelihood of your ad getting a click based on something Google knows about that specific query.
While the lack of transparency into the factors may be annoying, this relevance component has helped advertisers by automatically giving them more good clicks and fewer bad ones.

Landing Page Quality Score

The landing page is one of the newer factors used for QS. Landing Page Quality (LPQ) started as a way to counteract bad sites that duped users into clicking their ads and hence had a good CTR but a lousy user experience. Now that LPQ can also improve your QS, it’s getting a lot more attention from advertisers (probably more than it warrants).
Remember, the CTR of your ads is still the bigger QS factor and probably the better thing for most advertisers to focus on optimizing. Every now and then, I hear of advertisers who are spending a ton of time creating one landing page per keyword so that the keyword will appear on the page and score a better LPQ. That’s probably overkill — Google is very good at understanding how words are related, so it’s unnecessary to include every variation on the page.
My personal recommendation is to also keep a close eye on bounce rates and time on site, two metrics you can see directly in AdWords when you link it with Analytics. A high bounce rate or very short time on site both provide a great way for you to find keywords that are not relevant in the minds of users.

Optimizing The Right Elements Of Your Account

If you haven’t guessed by now, optimizing Quality Score is really all about optimizing for CTR. The challenge is to optimize for the right CTR. For example, because Google uses position normalization when determining how your CTR impacts your QS, it could very well be that your ad with a 15% CTR in the top position on Google is actually worse than your 3% CTR ad in the last place on the right side of the page.
You should also look at the impression-weighted Quality Score to determine which keywords and ad groups are most in need of an optimization. I shared a script for automating the calculation with AdWords Scripts.

Sunday, July 21, 2013

The Most Important KPI For A Performance Marketer

Many performance marketers continue to consider click-through rate (CTR) as a key performance indicator of their search campaigns’ effectiveness and evolve their PPC optimization strategy around that.
At the end of the day, what matters most is achieving the best ROI given your business objectives and budget, and you might optimize directly to CTR or ROI or a combination of success metrics to achieve that.
In order to have the best optimization strategy for your SEM campaigns, it is important to understand and quantify the influencers of ROI.

The Two Extreme Optimization Strategies

There are two types of strategies performance marketers consistently use as their campaign optimization strategy:
1)    Optimizing To A CTR Goal
One of the main factors influencing Quality Score (QS) is CTR, which affects your cost-per-click (CPC) and in turn affects your ROI. An increase in QS due to a boost in CTR would lower CPC and improve ROI.
CTR optimization
2)  Optimizing To An ROI Goal (Revenue-Per-Click & Cost-Per-Click)
Direct optimization to revenue or a conversion metric is a common strategy amongst performance marketers. Making sure an intelligent bid management is in use will be crucial to your campaign’s success.
ROI_GOALS1
While perhaps no marketer purely optimizes to CTR or ROI, they tend to skew towards one of these camps. Each method has its pros and cons. A CTR strategy will get you more clicks but does not guarantee the highest ROI. A purely ROI approach will get you the highest ROI but you potentially lose out on customers early in the sales funnel who might eventually convert.

ROI Breakdown

ROI equals Revenue-Per-Click (RPC) over Cost-Per-Click (CPC). Data analyzed from over two dozen advertisers using econometric methods (a simplified version of the equation is shown below) shows that 34% of ROI is influenced by RPC and 66% by CPC.
Bid management is by far the most important influencer of ROI. Forty-nine percent (49%) of ROI is influenced by bid management, 13% by other factors (i.e., marketplace, seasonality, etc.), and 4% by CTR. The data show the importance of having an intelligent bid management strategy in place for your SEM campaigns. But, does this mean a CTR maximizing strategy is a wasted effort?
ROI_MODELS1

A Deeper Dive Into The Relationship Between ROI & CTR

Previous studies have looked at the relationship between CTR & ROI by purely relying on correlations. A correlation analysis alone cannot determine the effects of CTR on ROI, and a more robust statistical technique is required to answer that question. These techniques enable us to control for all the factors that can potentially influence ROI.
From the chart below, we do see a relationship between the CTR & ROI — but not a very strong one.
SCATTERS

Applying statistical modeling techniques will allow us to quantify any statistically significant relationship between the two if it exists.
In this model, I control for position, CPC, industry, and bid management differences across the different advertisers in the data in addition to CTR.
The results show that there is a statistically significant relationship between CTR and ROI; but in terms of impact, it’s quite small. For a 10% increase in CTR, expect to see a 1.2% increase in ROI. This means that if you increase your CTR from 10% to 11% for a campaign with an average ROI of $5, the ROI will increase to $5.06 due to the improvements made in CTR.

Key Takeaways For Performance Marketers

  • Campaign managers should utilize both strategies above in optimizing their campaigns; main focus should be on ROI but do not completely ignore CTR
  • 49% of ROI is influenced by bid management; intelligent bidding is integral to a campaign’s success
  • CTR does have a small but statistically significant impact on ROI; a 10% change in CTR affects ROI by 1.2%

In Summary

Focus on optimizing your SEM campaigns for ROI but keep an eye on CTR. There is no need to purely optimize to CTR as it influences only 4% of ROI; but, it is important to account for it in your longer term strategy and make sure healthy CTR rates are met and maintained.
Intelligent bid management heavily influences ROI and is absolutely necessary to ensure your ROI goals are met.

Friday, April 19, 2013

How To Determine Your Hourly Bid Multipliers In AdWords

While hourly bid multipliers aren’t new, they remain a crucial tactic for optimizing your AdWords campaigns. They work by reducing your ad spend at poor-performing times of the week and increasing your exposure at the best times of the week. Here, I’m going to share the steps you can take (along with a helpful spreadsheet) to determine your hourly bid multipliers for better campaign optimization.

Step 1: Pulling An Hourly Performance Report From AdWords

On the Campaigns tab in AdWords, go to Columns>Customize Columns and ensure that you’ve selected the appropriate metrics. Performance metrics required for the spreadsheet to function properly are as follows: Campaign, Clicks, Impressions, Cost, Avg Pos, and Conv (1-per-click) — all other metrics selected in the screenshot below are optional:
Column Set
Once your performance metrics have been selected, hit the “Download Report” button. When prompted, add the “Day of the week” and “Hour of day” segments:
Segments
This should provide you with all the data you need to analyze hourly performance at the campaign level.

Step 2: Determining Hourly Bid Multipliers

Similar to the template used to determine mobile and geo bid multipliers, I’ve created a basic spreadsheet to help analyze hourly performance and easily determine your hourly bid multipliers. You can download it here.
Copy and paste your AdWords report into this spreadsheet as directed. From here, you can take a closer look at the following:
a. Performance By Day Of Week
by day of week
b. Performance By Hour
by hour
c. Performance By Hour & Day Of Week
by day of week and hour
If you have collected enough hourly data for each day of the week, you should absolutely make bid adjustments on an hourly basis. This process can be time consuming, as it requires making adjustments on a very granular level, but the results are well worth it.
For those times with less traffic, you can still leverage daily and/or hourly trends. For instance, looking at campaign #43 in the attached spreadsheet, it appears that there was not enough data collected on Sundays from 4:00 am to 5:00 am to make a specific bid multiplier suggestion — but you might still want to increase the bids, since the data indicate that both Sundays and the 4:00 am to 5:00 am window perform well in general.
The attached spreadsheet will only address those times of the week with sufficient hourly data, while keeping in mind that “bid adjustments for locations, days, times, and any ad group-level targeting methods can be set from -90% to +900%.” Thus, it can help you to determine relevant hourly bid multipliers between -90% and +900% when there are a statistically significant number of clicks:
hourly bid multipliers calculations

Step 3: Implement Hourly Bid Multipliers In AdWords

At the campaign level, navigate to the “Settings” tab; then, go to the “Ad schedule” section. The first step is to specify when you want to make bid changes. Select a day of the week from the drop-down menu:
setting time periods
From there, you can you can adjust the effective hourly bid multipliers, as calculated by the spreadsheet:
setting hourly bid multipliers

Conclusion

All of this is fairly straight-forward; however, your hourly bid multipliers need to be maintained over time, hence the importance of a (semi-)automated process. Also, keep in mind that once set in AdWords, those hourly bid changes do not take into account multiple time zones. For instance, if your AdWords account is set to “(GMT-08:00) Pacific Time,” and you want to increase the bids by 20% at 1 pm, then these bid changes will occur at 1 pm PST across all PST/MST/CST/EST locations. As a result, it makes sense to break down your top campaigns by time zone in order to set more accurate hourly bids.

Like Us on Facebook