With the continuing expansion of ad space at the top of the page (from ad extensions like sitelinks with descriptions), it’s more important than ever to make sure your ads have a great ad rank. But CPCs are on the rise –
so unless you can improve your conversion rate so you can increase
bids, Quality Score (QS) optimization may be your only way to maintain a
high rank without breaking the bank.
While I’ve been a panelist representing Google in Quality Score sessions at more conferences than I can remember, I’ve been meaning to put together some of my insights on the topic for a broader audience. So, here goes….
When I started working at Google in 2002, Quality Score didn’t exist. But what set Google apart from the other PPC ad systems at the time was how they determined if ads were relevant enough to warrant an impression. In addition to having a team of humans reviewing all ads, the system was also monitoring the click-through rate (CTR) of every keyword — if a keyword’s CTR fell below 0.5%, it would become disabled for poor relevance. Google was using the wisdom of the crowds to let its users determine which ads should show and which shouldn’t.
The problem with disabling keywords at an arbitrary CTR level was that advertisers were unhappy to see some of their keywords disabled forever (unless, of course, they knew of the workaround to resubmit the same keyword with different capitalization). So, we started to evolve the system. Instead of disabling keywords, we came up with new statuses like “slowed,” “in trial” and “on hold.”
The idea was to give advertisers a way to fix low-relevance keywords by giving them a small allowance to run ads that were considered poor quality so that they might prove otherwise. We also gave the system more flexibility so there wasn’t a hard cutoff at the 0.5% CTR level. Ultimately, though, most advertisers still saw keywords they really wanted to advertise on get disabled, and they remained displeased.
Google addressed this with the introduction of the minimum bid. Rather than flat out disabling keywords, they asked advertisers to pay more for keywords that had low relevance — the idea being that eventually, it would make no sense for an advertiser to keep paying the high cost-per-click (CPC), and they’d either optimize the relevance or delete the keyword.
In today’s system, the minimum bid has been engulfed by the first page bid, which also takes into account competition. It’s a little harder to see the direct correlation between what you pay and the quality score, but the connection’s definitely there.
Below is an example of where we see the correlation between the average CPC and the QS in our Quality Score Tracker tool.

Ad Rank = Max CPC * CTR
If you take a minute to look at this more closely, you’ll quickly see that ad rank is, in fact, equal to CPM or dollars-per-impression. This was the simple but brilliant insight that made AdWords so powerful — advertisers only had to pay when they got clicks, users would see more relevant ads because ads with high CTRs were more likely to appear high in the results, and Google was making as much money as possible from these ads.
The equation for ad rank is a whole lot more complicated these days and now includes thresholds for appearing at the top of the page, landing page factors, and more. But at the heart of it, the original principle still applies: if Google can show more relevant ads, they will get more clicks, have happier users and make more money. And, the key component for achieving this is CTR.
The importance of CTR to Quality Score is a bit like the importance of TF-IDF to SEO. While there are hundreds of factors that go into ranking in paid or organic search, these long-established principles are still some of the most important ones. In the 80/20 rule, these are your 80 percent factors and the first ones you should pay attention to.
To make sure advertisers have a level playing field, they evaluate small slices of CTR.
For example, they look at different CTRs by device type so that your performance on mobile won’t affect your performance on desktops. They also have a different CTR they look at for the Display Network and Google Search — a good thing, since CTR on Display is usually much lower, and you wouldn’t want that to hurt your QS for search.
Where possible, they also favor looking at the CTR when the keyword in your account matches the search query exactly (don’t confuse this with the “exact match” keyword match type), and they normalize the CTR based on the number of ads on the page and your ad’s position amongst them.
Furthermore, Google has to make some guesses before they have a statistically significant amount of CTR data for new accounts, new keywords and new ads, and they do this by evaluating the CTR at different levels as explained in the diagram below.
 As you can see, there are 3 levels of CTR evaluation: the account,
the keyword and the ad. These CTR elements are all combined into a
secret formula and out comes your keyword-level Quality Score and the
corresponding number between 1 and 10 that you can see in your account.
As you can see, there are 3 levels of CTR evaluation: the account,
the keyword and the ad. These CTR elements are all combined into a
secret formula and out comes your keyword-level Quality Score and the
corresponding number between 1 and 10 that you can see in your account.
To give an example, if you have 2 accounts, you should see a lower starting min bid in the account with the better account-level QS. If you have 2 domains, you will see a lower starting min bid when using the domain that has a better QS.
After the system gets enough data about more specific things, like how the keyword performs with the ad you wrote for it, it will rely much more on this to determine the Quality Score. This is why it’s so important to have great account structure and split up your ad groups in a way that allows you to create great performing ad texts for each grouping of tightly related keywords.
While the lack of transparency into the factors may be annoying, this relevance component has helped advertisers by automatically giving them more good clicks and fewer bad ones.
Remember, the CTR of your ads is still the bigger QS factor and probably the better thing for most advertisers to focus on optimizing. Every now and then, I hear of advertisers who are spending a ton of time creating one landing page per keyword so that the keyword will appear on the page and score a better LPQ. That’s probably overkill — Google is very good at understanding how words are related, so it’s unnecessary to include every variation on the page.
My personal recommendation is to also keep a close eye on bounce rates and time on site, two metrics you can see directly in AdWords when you link it with Analytics. A high bounce rate or very short time on site both provide a great way for you to find keywords that are not relevant in the minds of users.
You should also look at the impression-weighted Quality Score to determine which keywords and ad groups are most in need of an optimization. I shared a script for automating the calculation with AdWords Scripts.
While I’ve been a panelist representing Google in Quality Score sessions at more conferences than I can remember, I’ve been meaning to put together some of my insights on the topic for a broader audience. So, here goes….
The Evolution Of Quality Score
Even if you don’t care much for a history lesson, it may help paint a picture of why QS exists in the first place, and the evolution of factors may give you some insight into what Google cares about.When I started working at Google in 2002, Quality Score didn’t exist. But what set Google apart from the other PPC ad systems at the time was how they determined if ads were relevant enough to warrant an impression. In addition to having a team of humans reviewing all ads, the system was also monitoring the click-through rate (CTR) of every keyword — if a keyword’s CTR fell below 0.5%, it would become disabled for poor relevance. Google was using the wisdom of the crowds to let its users determine which ads should show and which shouldn’t.
The problem with disabling keywords at an arbitrary CTR level was that advertisers were unhappy to see some of their keywords disabled forever (unless, of course, they knew of the workaround to resubmit the same keyword with different capitalization). So, we started to evolve the system. Instead of disabling keywords, we came up with new statuses like “slowed,” “in trial” and “on hold.”
The idea was to give advertisers a way to fix low-relevance keywords by giving them a small allowance to run ads that were considered poor quality so that they might prove otherwise. We also gave the system more flexibility so there wasn’t a hard cutoff at the 0.5% CTR level. Ultimately, though, most advertisers still saw keywords they really wanted to advertise on get disabled, and they remained displeased.
Google addressed this with the introduction of the minimum bid. Rather than flat out disabling keywords, they asked advertisers to pay more for keywords that had low relevance — the idea being that eventually, it would make no sense for an advertiser to keep paying the high cost-per-click (CPC), and they’d either optimize the relevance or delete the keyword.
In today’s system, the minimum bid has been engulfed by the first page bid, which also takes into account competition. It’s a little harder to see the direct correlation between what you pay and the quality score, but the connection’s definitely there.
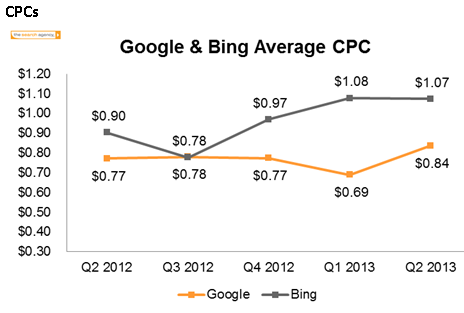
Below is an example of where we see the correlation between the average CPC and the QS in our Quality Score Tracker tool.
As the Quality Score starts to increase, the average CPC in this campaign starts to drop.
Quality Score’s Impact On Ad Rank
When Google launched AdWords Select and started to shift from CPM-based pricing to CPC-based pricing, they couldn’t afford to lose all the revenue from their CPM program (which was called AdWords at the time). They were still a pretty small company, and Yahoo/Overture was a formidable competitor. So, to ensure revenue was maximized, they ranked ads in the CPC program according to a very simple rule:Ad Rank = Max CPC * CTR
If you take a minute to look at this more closely, you’ll quickly see that ad rank is, in fact, equal to CPM or dollars-per-impression. This was the simple but brilliant insight that made AdWords so powerful — advertisers only had to pay when they got clicks, users would see more relevant ads because ads with high CTRs were more likely to appear high in the results, and Google was making as much money as possible from these ads.
The equation for ad rank is a whole lot more complicated these days and now includes thresholds for appearing at the top of the page, landing page factors, and more. But at the heart of it, the original principle still applies: if Google can show more relevant ads, they will get more clicks, have happier users and make more money. And, the key component for achieving this is CTR.
The importance of CTR to Quality Score is a bit like the importance of TF-IDF to SEO. While there are hundreds of factors that go into ranking in paid or organic search, these long-established principles are still some of the most important ones. In the 80/20 rule, these are your 80 percent factors and the first ones you should pay attention to.
Factors Of QS
While I’ve explained that CTR is a main driver in QS, it’s useful to understand how Google thinks about CTR. After all, there are many things that influence the CTR you see in your account such as the device, the network, or the position of your ad on the page. Thus, the average CTR you see in your account is not the CTR Google uses to determine Quality Score.To make sure advertisers have a level playing field, they evaluate small slices of CTR.
For example, they look at different CTRs by device type so that your performance on mobile won’t affect your performance on desktops. They also have a different CTR they look at for the Display Network and Google Search — a good thing, since CTR on Display is usually much lower, and you wouldn’t want that to hurt your QS for search.
Where possible, they also favor looking at the CTR when the keyword in your account matches the search query exactly (don’t confuse this with the “exact match” keyword match type), and they normalize the CTR based on the number of ads on the page and your ad’s position amongst them.
Furthermore, Google has to make some guesses before they have a statistically significant amount of CTR data for new accounts, new keywords and new ads, and they do this by evaluating the CTR at different levels as explained in the diagram below.
The various levels at which Google evaluates CTR to determine Quality Score.
How Quality Score Is Set For New Keywords
When a keyword is new in an account, there is not a strong historical element for how the keyword performs with its ad text (factor 3), so the QS is mostly based on system-wide data for that keyword in all other accounts. That gets combined with data for how this particular account and its ads have performed historically. If these elements have good QS, the new keyword is likely to also start off with a better QS.To give an example, if you have 2 accounts, you should see a lower starting min bid in the account with the better account-level QS. If you have 2 domains, you will see a lower starting min bid when using the domain that has a better QS.
After the system gets enough data about more specific things, like how the keyword performs with the ad you wrote for it, it will rely much more on this to determine the Quality Score. This is why it’s so important to have great account structure and split up your ad groups in a way that allows you to create great performing ad texts for each grouping of tightly related keywords.
Other Relevance Factors
According to Hal Varian, Google’s Chief Economist, QS also considers “relevance” in addition to CTR. But what does that mean? The easiest way to think about this is once again based on click-through rate — but, rather than using CTR to generate the QS number between 1 and 10 that you see for each keyword in your account, it’s used at the time a user does a search to determine if there are any correlations between that user’s search and your ad that could predict the CTR (Google’s Quality Score is a predictive system that tries to predict CTR for each ad and each query). Some examples:- Did the user’s search include some additional words, and do those correlate with your ad’s expected chance of getting clicked? E.g., if you have a job website and want to advertise on the keyword [jobs], your ad is probably not relevant when someone searches for “Steve Jobs.”
- Does the location of the user have any correlation to your predicted CTR? E.g., if your business is in the US and the searcher is in Belgium, perhaps it’s less likely your ad will get the click because the users may prefer a business closer to them.
- Does the time or day of week influence your predicted CTR? E.g., Google may know that users are less likely to click on your ad on a Tuesday.
While the lack of transparency into the factors may be annoying, this relevance component has helped advertisers by automatically giving them more good clicks and fewer bad ones.
Landing Page Quality Score
The landing page is one of the newer factors used for QS. Landing Page Quality (LPQ) started as a way to counteract bad sites that duped users into clicking their ads and hence had a good CTR but a lousy user experience. Now that LPQ can also improve your QS, it’s getting a lot more attention from advertisers (probably more than it warrants).Remember, the CTR of your ads is still the bigger QS factor and probably the better thing for most advertisers to focus on optimizing. Every now and then, I hear of advertisers who are spending a ton of time creating one landing page per keyword so that the keyword will appear on the page and score a better LPQ. That’s probably overkill — Google is very good at understanding how words are related, so it’s unnecessary to include every variation on the page.
My personal recommendation is to also keep a close eye on bounce rates and time on site, two metrics you can see directly in AdWords when you link it with Analytics. A high bounce rate or very short time on site both provide a great way for you to find keywords that are not relevant in the minds of users.
Optimizing The Right Elements Of Your Account
If you haven’t guessed by now, optimizing Quality Score is really all about optimizing for CTR. The challenge is to optimize for the right CTR. For example, because Google uses position normalization when determining how your CTR impacts your QS, it could very well be that your ad with a 15% CTR in the top position on Google is actually worse than your 3% CTR ad in the last place on the right side of the page.You should also look at the impression-weighted Quality Score to determine which keywords and ad groups are most in need of an optimization. I shared a script for automating the calculation with AdWords Scripts.